jvm-mon
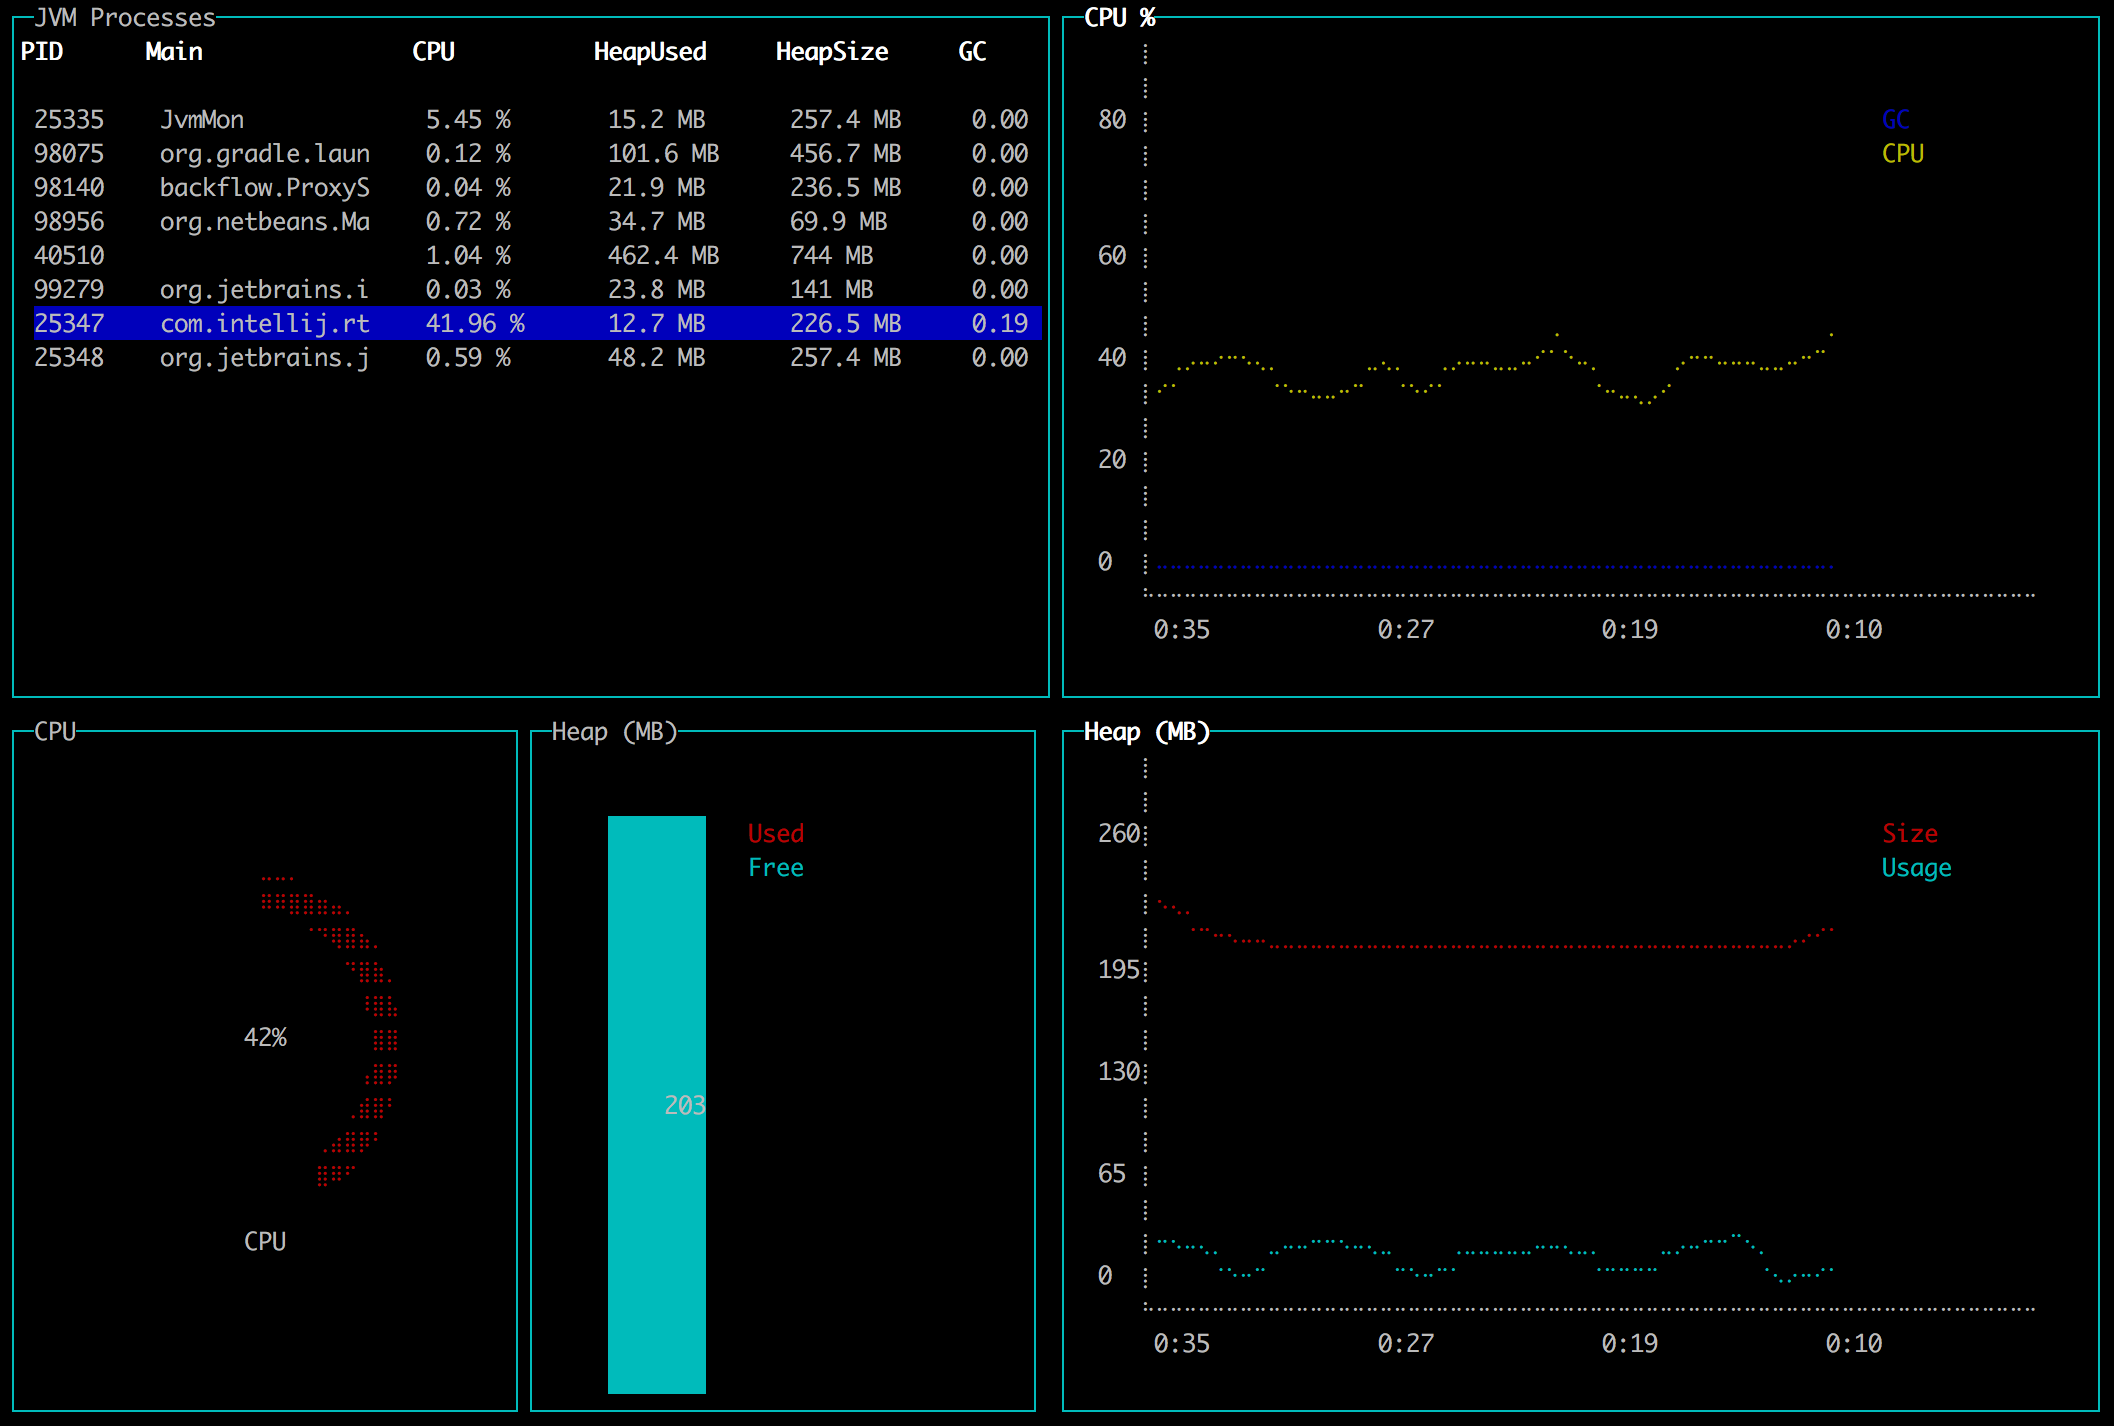
Console based JVM monitoring - when you just want to SSH into a server and see what’s going on.
jvm-mon lets you monitor your JVM server applications from the terminal.

New Version
Release: 1.3
- Rewritten in Go
- Single executable file
- Can monitor applications on Java 8 and above
- Does not require an existing JDK
How it works:
- jvm-mon executable comes bundled with a Java agent jar
- On startup it extracts the agent to a temp directory
- It attaches to the JVM you want to monitor
- Loads agent into running JVM to collect metrics
- Agent and app establish a socket connection to send metrics
Install
Download from latest release
macOS
brew install jvm-mon
Usage
- Select a JVM process and press Enter to monitor it
- Press q or Ctrl+C to exit
- Press Del or Backspace to kill a process
What is available
Currently it shows:
- List of running JVM processes
- Cpu and GC load
- Heap size and usage
- Top threads with cpu usage
Building from source
See the readme

